
Population ecology is the study of how the number of individuals of one species in an area changes over time, and why. It explains how populations grow, what stops them, and why small populations can vanish even when conditions look fine. This guide covers population size and density, exponential and logistic growth, carrying capacity, density dependence, demographic and environmental stochasticity, with a fit to real yeast data and an extinction risk simulation.
What Is a Population in Ecology?
In ecology, a population is a group of individuals of the same species living in the same area at the same time and able to interbreed. The red deer in one valley form a population; the red deer in a valley across a mountain range may form another if they rarely mix.
Ecologists describe populations with a few key traits:
- Size (N): the number of individuals.
- Density: individuals per unit area or volume, such as trees per hectare.
- Dispersion: how individuals are spread out: clumped (most common, around food or water), uniform (often from territoriality) or random.
- Age structure and sex ratio: how many young, breeding and old individuals there are, which predicts future growth.
- Birth, death, immigration and emigration rates: the four processes that change N.
Population size depends on both living and nonliving parts of the environment. Predators, competitors, parasites and food supply are covered in our guide to biotic factors.
Exponential Growth
If resources were unlimited, a population would grow by a constant proportion each time step. Ecologists write this as dN/dt = rN, where r is the intrinsic rate of increase (births minus deaths per individual). The bigger the population gets, the faster it adds new individuals, producing a J shaped curve.
Exponential growth does happen, but only for a while: bacteria in fresh culture medium, a species arriving on an empty island, or a population recovering after a crash. It can never last, because sooner or later something runs out.
Logistic Growth and Carrying Capacity
The carrying capacity (K) is the largest population an environment can support over time, given its food, water, space and other resources. As a population approaches K, growth slows, because each individual has fewer resources. The logistic model captures this: dN/dt = rN (K minus N) / K.
When N is small, the population grows almost exponentially. When N is halfway to K, growth is fastest. As N approaches K, growth slows to zero. The result is an S shaped (sigmoid) curve.
Case Study: Fitting the Logistic Model to Real Data
Textbooks often show the logistic curve as a smooth idealized line, so I tested it against one of the most famous real datasets in population biology: yeast grown in a closed culture, measured every hour for 18 hours by T. Carlson and published in 1913. Raymond Pearl later used these numbers to promote the logistic model. I fitted the logistic equation to the data with a nonlinear least squares fit in Python.
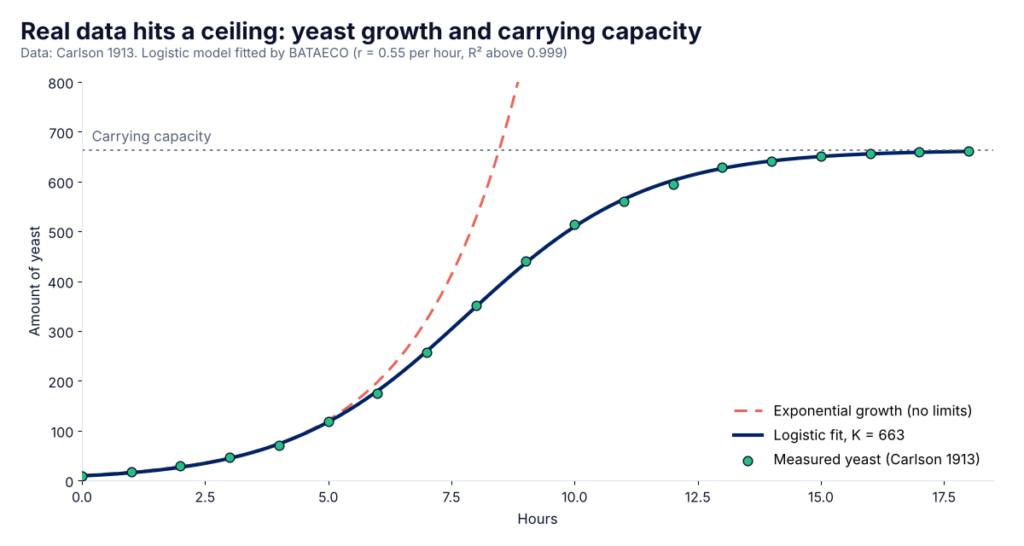
Results of the fit:
- Carrying capacity K = 663 (in the units Carlson used), almost exactly the plateau the yeast reached after 18 hours (661.8).
- Intrinsic growth rate r = 0.55 per hour.
- Fastest growth at about 7.8 hours, right where the population passed half of K, as the model predicts.
- The model explains more than 99.9% of the variation in the measurements (R² above 0.999).
An exponential model fitted to the first six hours tracks the data well at first, then overshoots wildly: by hour 9 it predicts more than the culture ever reached. That gap between the dashed and solid lines is the effect of limited resources.
My take as a biologist: a closed flask of yeast is the ideal case for the logistic model, a single species with a fixed food supply. Wild populations rarely fit this neatly. Their carrying capacity changes with seasons and weather, they lag behind changes in resources, and many overshoot K and crash. The logistic model is still useful as a baseline: if a real population departs from it, that departure tells you something interesting is going on.
Density Dependent and Density Independent Factors
Density dependent factors get stronger as a population gets more crowded. Competition for food, predation, disease, parasites and stress all increase with density, raising deaths or lowering births. They are the reason populations level off near K.
Density independent factors affect a population regardless of its size. Floods, droughts, fires, frosts and pollution can kill the same share of individuals whether the population is large or small.
r Selected and K Selected Species
Life history strategies sit on a spectrum. r selected species (many insects, weeds, small fish) reproduce early, produce many small offspring, invest little in each and do well in unstable environments. K selected species (elephants, whales, great apes, many trees) mature late, produce few large offspring, invest heavily in care and do well in stable, crowded environments near carrying capacity. Most species fall somewhere in between, and the labels describe tendencies rather than strict categories.
Survivorship Curves
- Type I: most individuals survive to old age, then die quickly (humans, large mammals).
- Type II: a constant chance of dying at every age (many birds, some lizards).
- Type III: very high death rates in the young, with a few survivors living long (most fish, oysters, many plants).
Demographic and Environmental Stochasticity
Real populations do not follow smooth curves, because chance plays a role. Ecologists separate two kinds of randomness:
- Demographic stochasticity is chance variation in the births and deaths of individuals. By luck, one year more animals die than usual, or all the offspring are male. In a large population these effects cancel out. In a small one they can be fatal.
- Environmental stochasticity is random variation in conditions that affects everyone at once: a harsh winter, a drought year, a disease outbreak. It affects populations of all sizes, though small ones have less buffer.
To show how strong demographic stochasticity is, I ran a second simulation. Each population had an average growth rate of exactly zero (on average each individual replaces itself), but births and deaths were random. I ran 10,000 populations for each starting size and counted how many went extinct within 50 years.
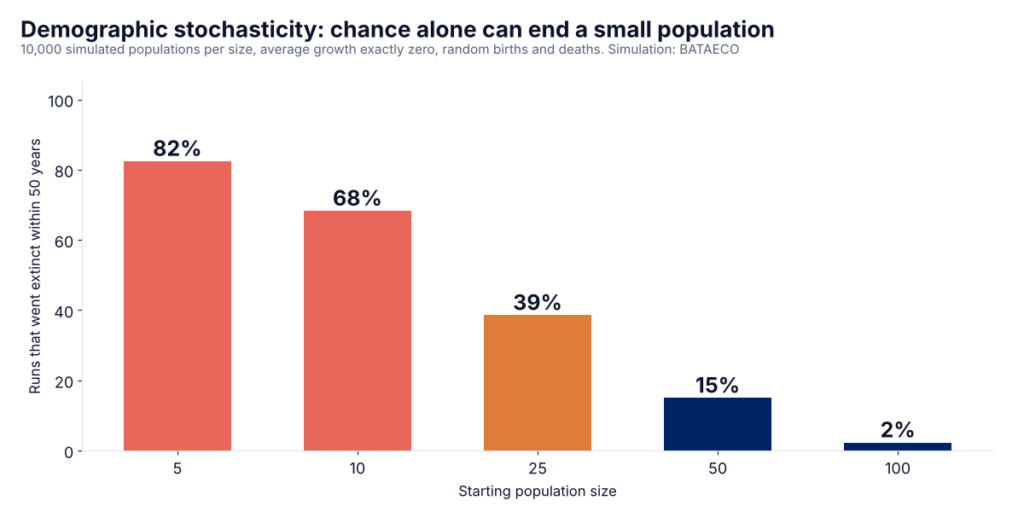
Starting with 5 individuals, 82% of populations went extinct; with 10, 68%; with 25, 39%; with 50, 15%; and with 100, only 2%. Nothing in the environment was against them. This is a deliberately simple model with large random swings, so the exact percentages should not be applied to any real species, but the pattern is robust and underlies the idea of a minimum viable population. Small populations also lose genetic variation through chance, as explained in our guide to genetic drift, which makes the risk worse.
Frequently Asked Questions
What is carrying capacity in simple terms?
The largest number of individuals of a species that an environment can support over the long term with its available food, water, shelter and space.
What is the difference between exponential and logistic growth?
Exponential growth assumes unlimited resources and produces a J shaped curve that keeps accelerating. Logistic growth includes a carrying capacity, so growth slows as the population fills its environment, producing an S shaped curve.
Can a population exceed its carrying capacity?
Yes, temporarily. Populations can overshoot K when resources were abundant in the past, then crash as resources run out. Overshoot can also lower K by damaging the habitat.
What is demographic stochasticity?
Random variation in births and deaths among individuals. It matters most in small populations, where a run of bad luck can drive the population extinct.
Why do small populations go extinct more easily?
Because of demographic stochasticity, environmental shocks, loss of genetic variation and inbreeding, which often act together.
Sources
- Carlson, T. (1913). Growth of yeast. Biochemische Zeitschrift 57: 313. Data via University of Arizona, Lomen and Lovelock data sets.
- OpenStax Biology 2e, Environmental Limits to Population Growth.

Erzsebet (Eli) Frey is a biologist with a BSc in Biology and an MSc in Ecology from the University of Belgrade. She has field and lab experience across Asia, the Middle East, Europe and South America and uses Python and machine learning on biological data. Based in Serbia, she writes BATAECO and also runs Simply Ecologist and Eco&Stylish.