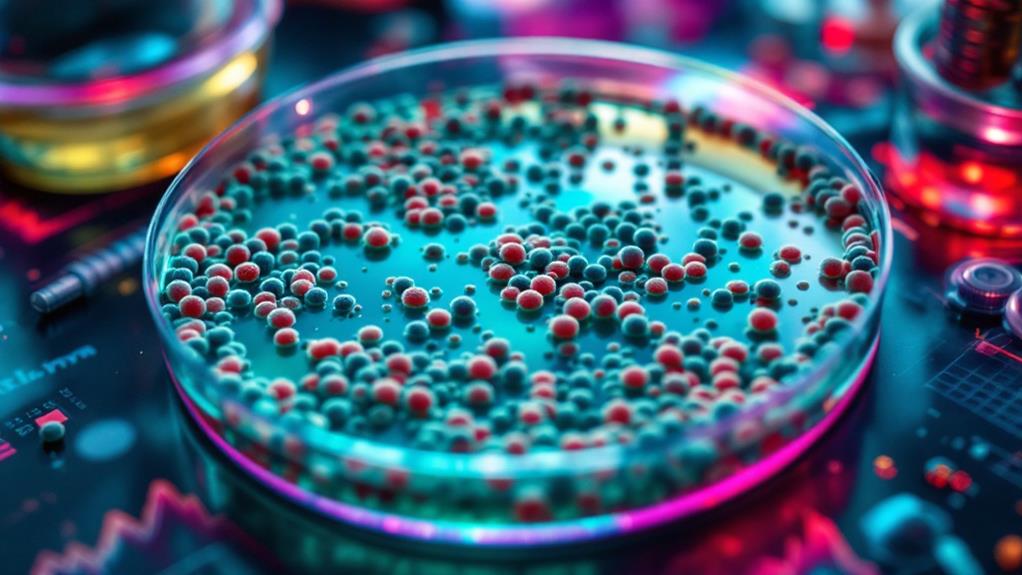
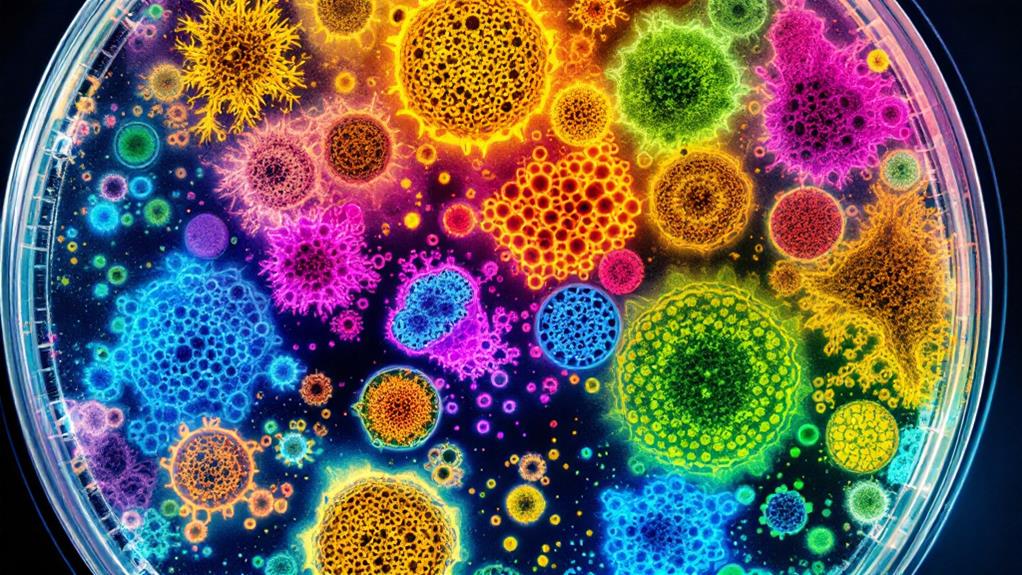
Bacterial growth curves consist of four main phases: lag, exponential growth, stationary, and death. In the lag phase, bacteria adapt to their environment without multiplying. The exponential phase sees rapid cell division and population doubling. During the stationary phase, growth slows as resources become limited. Finally, the death phase occurs when nutrients are depleted and waste accumulates. Each phase is influenced by factors like temperature, pH, and nutrient availability. Understanding these phases is essential for applications in antibiotic research, industrial microbiology, and food safety. Exploring the intricacies of each stage reveals fascinating insights into bacterial behavior and survival strategies.
The Lag Phase
The lag phase marks the initial stage of bacterial growth when cells adapt to their new environment. During this period, you won’t observe an increase in cell numbers, but don’t be fooled—there’s a lot happening beneath the surface. Bacteria are busy preparing for rapid growth by synthesizing enzymes, proteins, and RNA.
When you introduce bacteria to a fresh medium, they need time to adjust. They’re sensing their surroundings, activating necessary genes, and ramping up their metabolic machinery. This adaptation process can take anywhere from a few minutes to several hours, depending on the bacterial species and environmental conditions.
You’ll notice that older or stressed bacterial cultures typically have longer lag phases. They need extra time to repair damage and replenish depleted resources before they can start dividing. Conversely, if you transfer bacteria from a nutrient-rich environment to a similar one, the lag phase might be quite short.
During the lag phase, bacteria are particularly vulnerable to antibiotics and other stressors. They haven’t yet built up their defenses or established a robust population. This vulnerability makes the lag phase a critical window for antimicrobial treatments.
As you study bacterial growth, you’ll find that the duration of the lag phase can provide valuable information about the state of your bacterial population and the suitability of the growth medium. By monitoring this phase closely, you can gain insights into bacterial physiology and optimize growth conditions for your experiments or industrial processes.
Exponential Growth Phase
After the lag phase, bacteria enter a period of rapid multiplication known as the exponential growth phase. During this stage, you’ll observe a dramatic increase in the bacterial population as cells divide at a constant rate. This phase is characterized by binary fission, where each cell splits into two identical daughter cells.
The growth rate during this phase is exponential, meaning the population doubles at regular intervals. You’ll notice that the number of bacteria increases logarithmically when plotted on a graph. The time it takes for the population to double is called the generation time or doubling time, which varies among different bacterial species and environmental conditions.
Several factors influence the rate of growth during this phase. These include nutrient availability, temperature, pH, and oxygen levels. You’ll find that favorable conditions lead to faster growth rates and shorter generation times. For example, E. coli can double every 20 minutes under ideal conditions.
As you study this phase, you’ll observe that bacteria are at their most metabolically active. They’re rapidly synthesizing new cell components, including proteins, nucleic acids, and cell wall materials. This high metabolic activity makes the exponential phase perfect for many industrial and research applications, such as the production of enzymes or antibiotics.
It’s important to note that the exponential phase doesn’t continue indefinitely. As nutrients become depleted and waste products accumulate, you’ll see the growth rate slow down, eventually leading to the stationary phase.
Stationary Phase Characteristics

Shifting from exponential growth, bacteria enter the stationary phase when their population size stabilizes. During this phase, you’ll observe a plateau in the growth curve, where the number of new cells formed roughly equals the number of cells dying. This balance results from various factors that limit further population expansion.
In the stationary phase, you’ll notice bacteria adapting to resource scarcity. They’ll reduce their metabolic activity and enter a state of dormancy to conserve energy. You’ll find that many bacteria produce secondary metabolites during this time, including antibiotics, pigments, and other bioactive compounds.
You’ll see significant changes in gene expression as bacteria shift into the stationary phase. They’ll activate stress response genes and produce proteins that help them survive adverse conditions. These adaptations enable bacteria to withstand environmental stressors like nutrient depletion, waste accumulation, and pH changes.
As you study the stationary phase, you’ll observe that bacteria become more resistant to antibiotics and other antimicrobial agents. This increased tolerance is partly due to the slower growth rate and physiological changes that occur during this phase.
You’ll find that the duration of the stationary phase varies depending on the bacterial species and environmental conditions. Some bacteria can remain in this phase for extended periods, while others may quickly progress to the death phase if conditions don’t improve.
Understanding the characteristics of the stationary phase is vital for various applications, including industrial fermentation, wastewater treatment, and the development of new antimicrobial strategies. By manipulating the conditions that trigger or prolong this phase, you can optimize bacterial processes for specific purposes.
Death Phase Explained
Death phase marks the final stage of the bacterial growth curve, characterized by a rapid decline in viable cell numbers. During this phase, you’ll observe a significant decrease in the bacterial population as the death rate surpasses the growth rate. Several factors contribute to this decline, including the depletion of essential nutrients, accumulation of toxic waste products, and changes in environmental conditions.
As you study the death phase, you’ll notice that not all cells die simultaneously. Some bacteria may enter a dormant state, becoming viable but non-culturable (VBNC). These cells can’t be detected through traditional culturing methods but may still be metabolically active. It’s important to take this into account when analyzing bacterial populations.
The rate of cell death can vary depending on the bacterial species and environmental conditions. You’ll find that some bacteria die off quickly, while others may persist for extended periods. Factors such as temperature, pH, and the presence of antimicrobial compounds can influence the death rate.
During the death phase, you might observe cellular lysis, where bacterial cells rupture and release their contents into the environment. This process can provide nutrients for surviving cells or other microorganisms in the vicinity. Additionally, you may notice morphological changes in the remaining cells as they adapt to the harsh conditions.
Understanding the death phase is essential for various applications, including food preservation, wastewater treatment, and antibiotic efficacy studies. By manipulating environmental factors, you can accelerate or delay the onset of the death phase, which has practical implications in many fields of microbiology and biotechnology.
Factors Affecting Growth Curves
The bacterial growth curve isn’t a fixed, immutable process. Various factors can notably influence its shape, duration, and overall characteristics. You’ll find that environmental conditions play an essential role in determining how bacteria grow and multiply.
Temperature is a key factor affecting bacterial growth curves. Each bacterial species has a preferable temperature range for growth. When you maintain the environment at this ideal temperature, you’ll observe faster growth rates and shorter lag phases. Conversely, temperatures outside this range can slow growth or even halt it entirely.
Nutrient availability is another vital factor. The type and concentration of nutrients in the growth medium directly impact bacterial growth. You’ll notice that rich media with abundant nutrients typically result in steeper exponential phases and higher maximum population densities. In contrast, nutrient-poor environments can lead to extended lag phases and slower overall growth.
pH levels also notably influence bacterial growth curves. Most bacteria thrive in neutral pH environments, but some species are adapted to acidic or alkaline conditions. You’ll find that exposure to non-preferable pH levels can stress bacteria, leading to longer lag phases or reduced growth rates.
Oxygen availability is essential for aerobic bacteria but can be detrimental to anaerobes. When you’re working with aerobic species, ensuring proper aeration will promote faster growth and higher cell densities. Conversely, anaerobic bacteria will thrive in oxygen-depleted environments.
Lastly, the presence of antimicrobial agents or competing microorganisms can dramatically alter growth curves. You’ll observe that these factors can extend lag phases, reduce growth rates, or trigger early onset of the death phase.
Measuring Bacterial Population Changes
How do scientists accurately track the growth of bacterial populations over time? They employ various methods to measure changes in bacterial numbers, each with its own advantages and limitations.
One common technique you’ll encounter is the plate count method. You’ll dilute your bacterial sample and spread it on agar plates. After incubation, you’ll count the visible colonies, each representing a single bacterium from the original sample. This method gives you a direct count of viable cells but can be time-consuming and labor-intensive.
Spectrophotometry offers a quicker alternative. You’ll measure the optical density of your bacterial suspension, which increases as the population grows. While this method is fast and non-destructive, it can’t distinguish between live and dead cells.
For real-time monitoring, you might use flow cytometry. This technique allows you to analyze individual cells as they pass through a laser beam. You’ll get information on cell size, shape, and even specific cellular components if you use fluorescent markers.
Molecular methods like quantitative PCR (qPCR) can provide highly specific measurements. You’ll amplify and quantify specific DNA sequences, allowing you to track particular bacterial species within a mixed population.
Newer technologies like microfluidic devices and biosensors offer continuous, automated monitoring of bacterial growth. These systems can provide high-resolution data on population dynamics and are particularly useful for long-term experiments.
Each method has its place in bacterial growth studies. You’ll need to choose the most appropriate technique based on your specific research questions, available resources, and the level of detail required in your measurements.
Applications in Scientific Research
Understanding bacterial growth curves has numerous applications in scientific research. You’ll find these growth patterns fundamental in various fields, including microbiology, biotechnology, and medicine. By studying these curves, you can predict bacterial behavior, optimize growth conditions, and develop strategies to control microbial populations.
In antibiotic research, you’ll use growth curves to assess the effectiveness of new drugs. By comparing the growth patterns of bacteria exposed to different antibiotics, you can determine which compounds are most effective at inhibiting bacterial growth. This information is essential for developing new treatments for bacterial infections.
When you’re working in industrial microbiology, you’ll rely on growth curves to optimize fermentation processes. By understanding how bacteria grow under different conditions, you can adjust parameters like temperature, pH, and nutrient availability to maximize product yield. This is particularly important in the production of biofuels, enzymes, and other microbial-derived products.
In environmental microbiology, you’ll use growth curves to study how bacteria respond to different pollutants or environmental stressors. This information can help you develop better bioremediation strategies or assess the impact of contaminants on microbial ecosystems.
You’ll also find growth curves valuable in food safety research. By studying how pathogens grow in different food products, you can develop more effective preservation methods and storage guidelines. This helps prevent foodborne illnesses and extends the shelf life of perishable goods.
In medical research, you’ll use growth curves to study the interactions between bacteria and the immune system. This can help you develop new vaccines or immunotherapies to combat bacterial infections.

Erzsebet Frey (Eli Frey) is an ecologist and online entrepreneur with a Master of Science in Ecology from the University of Belgrade. Originally from Serbia, she has lived in Sri Lanka since 2017. Eli has worked internationally in countries like Oman, Brazil, Germany, and Sri Lanka. In 2018, she expanded into SEO and blogging, completing courses from UC Davis and Edinburgh. Eli has founded multiple websites focused on biology, ecology, environmental science, sustainable and simple living, and outdoor activities. She enjoys creating nature and simple living videos on YouTube and participates in speleology, diving, and hiking.

